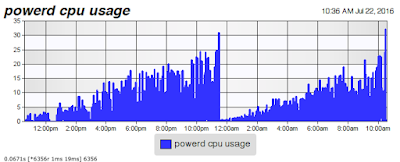
On one site someone offered a bash shell script to regularly monitor the CPU usage of powerd and to kill it if it goes above 30%. I’ve wrapped that into an executable file that actually starts up in bash and doesn’t throw errors trying to run in tcsh which is the default shell on my system. I also added some code to send the CPU usage to XTension as well as keep track of the restart count. This way I can graph the CPU usage which looks like this over the last 2 days:
It takes just short of 11 hours for the spikes in activity to exceed the 30% threshold that causes the script to kill it and the system restarts it. I have no idea what the problem is, but something is definitely going on there. This graph is 24 hours of samples taken every 10 seconds so what you can’t see is that still most of the time in between those peaks it’s at 0% usage. Then it goes to do something periodically and each time it does it it takes a little bit more time. Some table not getting cleared? I don’t know what the cause is but it’s definitely real looking at that. Eventually if not killed the CPU usage becomes constant as it doesn’t finish servicing it’s queue before it has to service it again and the CPU usage becomes constant and debilitating to the machine.
If you’re also suffering from problems while having to continually kill powerd you can use this script. Cut and paste the code into any text editor, I like TextWranlger rather than using text edit built into the system, but any of them will work. Save it with the filename “powerd_monitor.command” the name is important! It must end in “.command” (and not .command.txt which text edit might try to add to the end of it) and it must be named powerd_monitor. This is because the script searches through the list of all processes for those containing the term “powerd” and it has to know how to exclude itself from the list that is returned. If you name it something else that also includes the term “powerd” then it will find multiple matches when searching and everything will error out and fail to do anything for you. So name the file “powerd_monitor.command”
You have to add the execute bit to the file. without that it won’t run when you double click it. If you’re terminal aware then thats easy. For anyone who isn’t you can do so by opening a terminal window and typing “chmod a+x “ (note the space after the x!) and then dragging the text file you’ve just created into the terminal window and pressing return.
If you aren’t an XTension user then you’ll want to remove the 2 lines that echo an applescript into osascript. Otherwise you’ll get an error printed for that with each check. Remove the 2 lines that begin “echo “tell app \”XTension\””
Lastly you must fill in your admin password into the first line of code where is says “sudopass=“ since the powerd is owned by the system and not the user you can’t kill it without executing the kill command with sudo to get the proper permissions to do so. Otherwise it will fail to actually stop the process.
The output in the terminal is multiplied by 100. So 0.1% comes out as a 10 and so forth. I don’t know why the original script author had to do that, but I suspect it’s because bash is bad at math and wasn’t able to compare against floating point numbers properly.
The interval is currently set to check once a minute, but you can extend that or reduce it as necessary by changing the sleep value at the end. Of course, running the script too often will cause it to use far more CPU time than is necessary and make your problem worse not better. I generated the graph above with a check happening every 10 seconds.
#!/bin/bash
# fill in your sudo password below or it won't be able to kill the process
# in XTension create a dimmable pseudo unit named "powerd cpu usage"
# in XTension create another dimmable pseudo unit named "powerd restart count"
# checks the cpu usage of powerd and if it's more than 30% it will kill it for you
# the output of the echo value is *100 so will say 40 for 0.4%!
sudopass='your sudo password here'
while true ; do
cpu_usage=`ps aux | grep powerd | grep -v grep | grep -v powerd_monitor| awk 'BEGIN {ORS=""} {print $3*100}'`
echo "powerd is using $cpu_usage"
echo "tell app \"XTension\" to set value of \"powerd cpu usage\" to ($cpu_usage / 100)" | osascript -
if [ $cpu_usage -ge 3000 ] ; then
echo 'killing powerd!!!'
echo $sudopass | sudo -S /usr/bin/killall powerd
echo "tell app \"XTension\" to set value of \"powerd restart count\" to value of \"powerd restart count\" + 1" | osascript -
fi
sleep 60
done
UPDATE: it sure looks like just not running activity monitor is keeping it from climbing away in my case.
Since about 10:30am it’s CPU usage hasn’t climbed above about 0.5% of the CPU that it’s running on. It shows no signs of continuing to leak CPU time.
This is definitely not the only problem that causes this as my day job work neighbor Michael has the problem and has never left activity monitor running on his machine. I expect that just quitting the program won’t solve the problem, but it might keep it from continuing to escalate until you restart or kill the powerd. I will continue to watch and post any further observations as it’s a very frustrating problem!

